Case Study · Ecommerce · Google Ads

From a standing start to a €1.15M month - in six months, across seven markets.

In June 2025, MysaLights - a premium European lighting brand - had zero revenue, zero ad history, and a brand nobody had ever searched for. Google Ads was the only paid channel. By November, the store closed the month at €1.15M in sales on roughly €240k of ad spend - a MER of ~4.7x. This is how we built it.

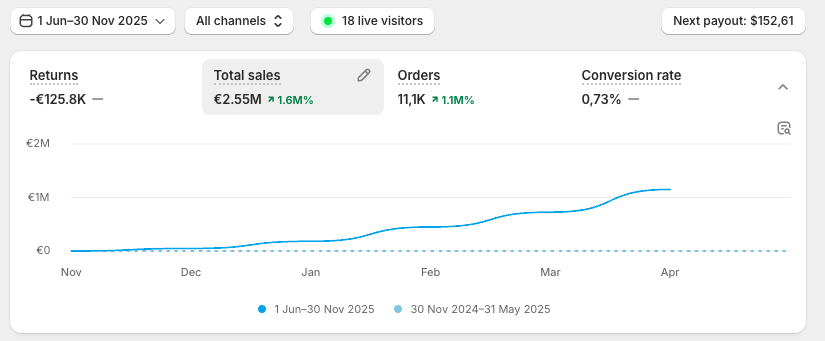
MysaLights Shopify dashboard - €2.55M total sales
Shopify · Live store dashboard
€1.15M
Revenue · Nov 2025
6 mo
From zero to peak
7
Profitable markets
3.7x
Blended ROAS · full period
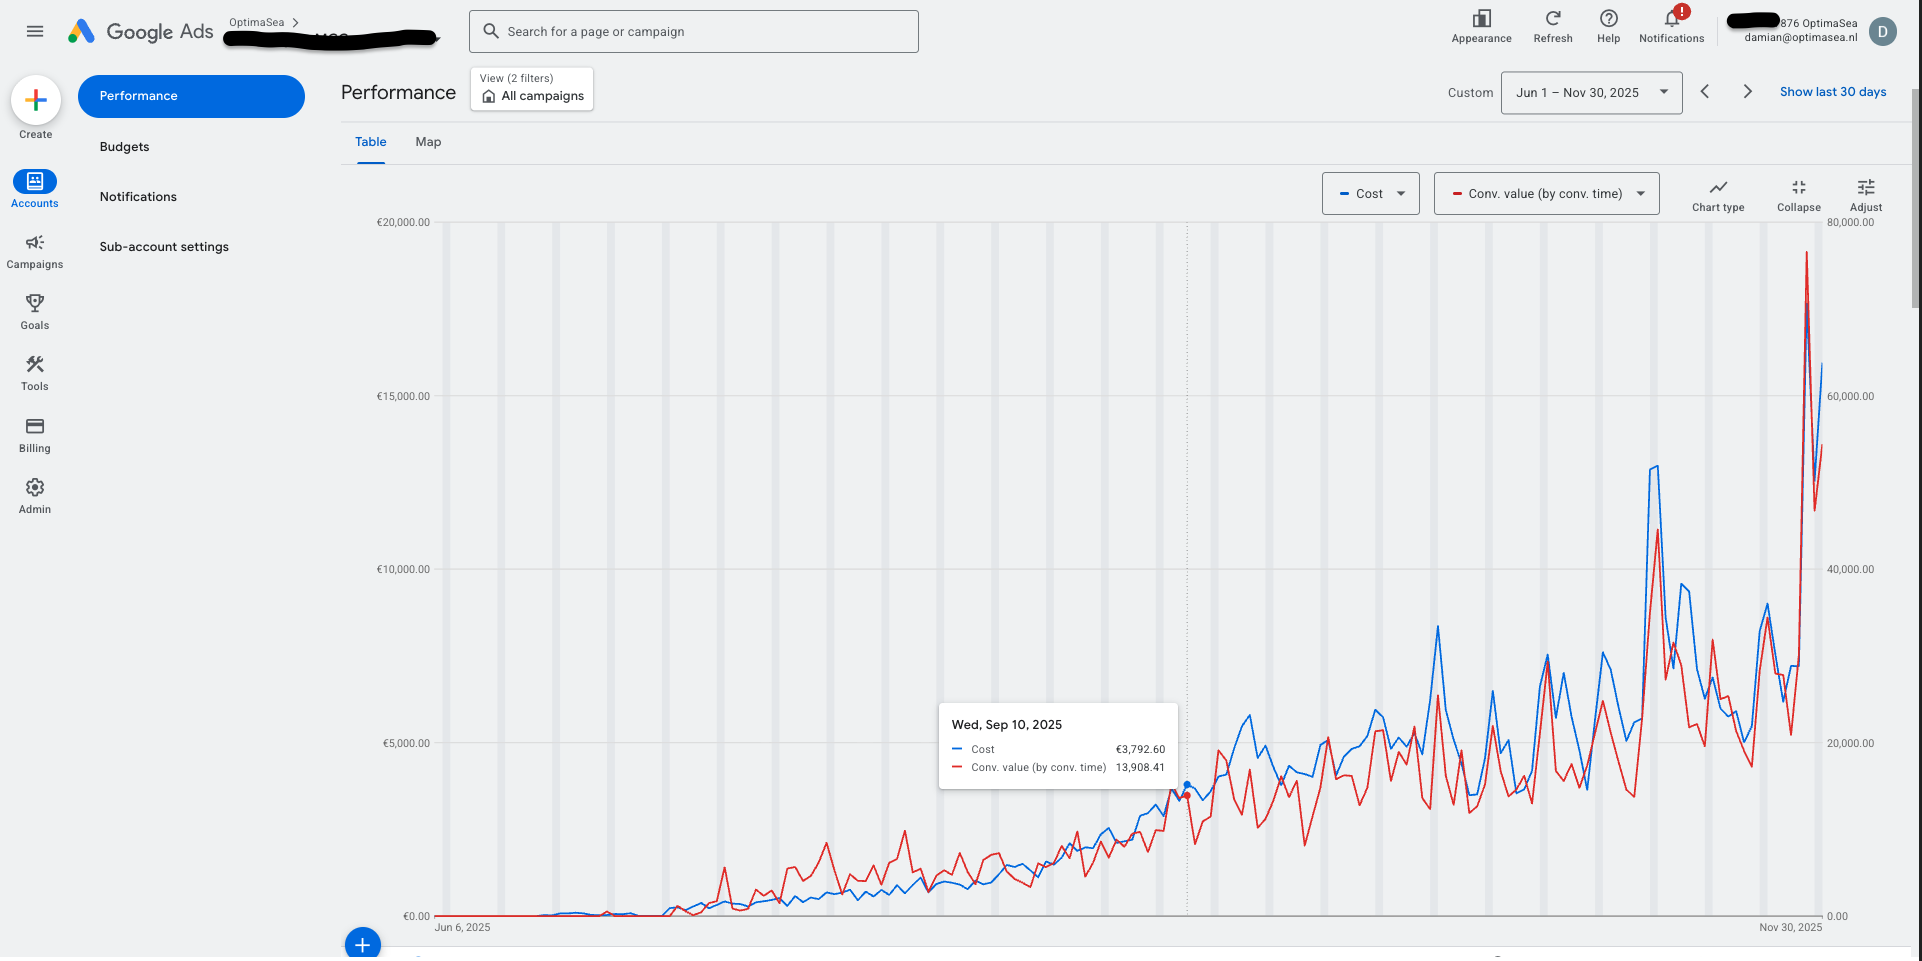
Google Ads performance - cost vs. conversion value, Jun-Nov 2025
Google Ads · Cost vs. conversion value
01 -

The starting line: nothing

No brand searches. No conversion history. No remarketing lists. Smart Bidding had nothing to learn from, and every competitor in the lighting space had years of feed and account history we didn't.

MysaLights sells design-led, premium lighting - pendant, ceiling, wall, table and floor - to design-conscious homeowners. Beautiful product, healthy margins, and a deliberately compact catalog where every product had to pull its weight.

The brief was simple and ambitious: build a multi-market European ecommerce engine, fast, without burning cash to do it. Our senior team ran Google Ads, feed engineering, and conversion strategy; the client owned site, fulfilment, and operations. Decisions were made weekly, between the people doing the work.

There's an upside to starting from nothing that most case studies never mention: with no brand demand and no other paid channels, every order in this story was demand the ads created. No existing traffic for the platform to quietly claim credit for.

We made one structural bet up front that shaped everything after it: in Shopping and Performance Max, the feed is the campaign. Win the feed, and the account can stay simple.

The cold-start problem - how do you scale Smart Bidding with zero history?

A new account gives Google's bidding nothing to learn from, so the first weeks are about manufacturing clean signal as fast as possible: a feed rich enough to match high-intent queries from day one, conversion tracking verified before the first euro of spend, and budgets held deliberately small until purchase data - not clicks - started accumulating.

From there, every move was bounded: budget steps capped to roughly ±20%, tROAS moves to ±10-15%, each gated on trailing 14-day performance with conversion lag factored in. Slow hands early, heavy hands later. That's why the June bar on the chart below is embarrassingly small - and why the account could double through the summer without the bidding ever wobbling.

02 -

Six months, one direction

Month-over-month, June through November 2025. Revenue doubled every month through September, then added another 31% and 51% into peak - with every month above the profitability bar. Tap or hover any month for the full picture, or switch the view.

Google-attributed revenue / month
November total store revenue reached €1.15M (Shopify) on ~€240k ad spend - a blended MER of ~4.7x. Early months ran deliberately small: July's €85k came off roughly €11.5k of spend while the account earned its scale.
How we measure - read this before you trust any agency chart

Revenue bars are Google Ads-attributed conversion value (purchase conversions, data-driven attribution, 30-day click window), pulled from the ad accounts - not estimated. Store revenue (€1.15M in November) is Shopify's number, shown separately and never mixed into the chart.

Why we also quote MER: platform-attributed ROAS can be flattered by attribution models. MER - total store revenue divided by total ad spend - can't. November's MER was ~4.7x. And because this brand launched with no organic equity, no email list, and no other paid channels, attributed and incremental are unusually close here: there was no existing demand for Google to claim credit for.

What we're not showing: client margin data stays confidential. What we can say: profitability thresholds were set with the client's actual unit economics, and every market was held above contribution-positive levels once past its ramp-up weeks - including during Black Friday promotional pricing.
03 -

The custom feed: our unfair advantage

Feed-powered campaigns carried the overwhelming majority of revenue - because we built the account so they could. With a compact catalog you can't out-spend the big lighting retailers. You can out-data them.

This case started clean. Most don't - and that's fine.

Most accounts we take over look like the "typical feed" tab above - plus broken tracking and a campaign structure held together with tape. Rebuilding that is not a detour from our process. It is the first two weeks of our process.

Messy feed?

We rebuild it. Titles, attributes, identifiers, labels - the same system you've just read about, applied to your catalog.

Broken tracking?

We audit and re-architect conversion tracking before scaling a euro. Bad data in, bad bidding out - it's always step one.

Existing account history?

Takeovers get a transition plan: nothing gets torn down while it's converting. We earn structural changes the same way we earn budget.

04 -

Simple account, relentless operation

The complexity lived in the feed - so the account could stay deliberately simple, and the daily work could stay sharp. Here's what "daily optimization" actually means, in plain terms.

- architecture

Consolidated by design

Per market: one or two Performance Max campaigns carrying volume, asset groups per category with matched creative and landing pages, and bestsellers split from the long tail - because blended targets starve discovery on new products and overspend on proven ones. Fewer campaigns, more data per campaign, better bidding.

- daily · pacing

Budgets earn their increases

Every market, every day: pacing checked, returns checked, and budgets only moved when trailing performance proved they should - in bounded steps (±20% budget, ±10-15% on targets), never on a hunch. That's how spend grew from under €1k to ~€240k a month without the bidding ever destabilizing.

- daily · hygiene

Query & placement sweeps

Daily review of what searches and placements money actually went to - cutting waste while it's still small. Across seven markets, that's thousands of small decisions that are individually trivial and collectively the difference between mediocre and 3.7x.

- daily · feed

Feed health & price position

Merchant Center diagnostics, disapproval triage, and price competitiveness - checked every morning. When the feed is your engine, you check the engine daily.

The scaling rule was profit-first, not vanity-ROAS: scale wherever headroom exists, gate every increase on trailing returns, and accept short-term variance when absolute contribution grows.

05 -

Seven markets in four months - each profitable in weeks

Expansion ran on a playbook: validate demand first, launch from a proven template, localize natively - and let each market earn the next one. It didn't all work. We show that too.

June 2025

Germany, Austria & Switzerland - the proving ground

First launch, from absolute zero. Deliberately small budgets while conversion data accumulated, past break-even on ad spend by week 5, then sustained 3.5-4.5x ROAS from week 6 onward. The DACH region became the engine room - €308k attributed revenue in November alone.

Break-even by week 53.5-4.5x sustained
July 2025

United Kingdom + Benelux

The template cloned for the first time: localized feed, native copy, market-adjusted pricing. Both scaled steadily to €130k+ attributed months by November.

Each €130k+/month by Nov
August 2025

France

The playbook at full speed: 4.5x ROAS by week three on meaningful spend - €16k+/week in revenue and climbing. France finished November at €133k attributed, the best efficiency of the large markets.

4.5x ROAS in week 3
September 2025

Scandinavia, Spain & Italy - three at once

With the template battle-tested, three markets launched simultaneously. Scandinavia was the fastest launch-to-profit we recorded - profitable inside its first two weeks, contribution-positive for its full first month, and still scaling at peak. All three were.

All 3 profitable in month one
Also worth knowing

The launches we killed

Canada, Poland, New Zealand and the UAE got small probe budgets during the same period. Demand or unit economics didn't clear the bar - so they were cut within weeks, before they could burn meaningful money. "Demand-validated first" only means something if some validations fail.

4 probes cut early - by design
November 2025

Peak season, all engines running

Seven markets live, ~€240k monthly ad spend, ~€840k Google-attributed revenue, €1.15M total store revenue.

€1.15M month · MER ~4.7x
MarketLaunchedNov spendNov attributed revenueNov ROAS
DACH (DE·AT·CH)June€86k€308k3.6x
United KingdomJuly£44k£135k3.1x
BeneluxJuly€40k€132k3.3x
FranceAugust€35k€133k3.8x
ScandinaviaSeptember€22k€66k3.0x
ItalySeptember€10k€39k3.9x
SpainSeptember€7k€27k3.9x

November 2025, per ad account. Google Ads-attributed conversion value. UK figures in GBP, so columns don't sum exactly to the EUR totals quoted above. No market below 3.0x - scaling never came at the price of a bleeding market.

Black Friday, five months in

A brand that didn't exist in May went into its first-ever Black Friday with seven markets live, a battle-tested feed, and budgets pre-positioned weeks in advance.

€57k+
Attributed revenue · Black Friday alone
€155k
BFCM weekend (Fri-Sun)
3.3x
ROAS - above profitability even at promo pricing

And the products carried it. One especially.

A single hero - a Scandinavian round ceiling light - generated €42k+ in attributed revenue and 220+ orders in the DACH market alone, with siblings performing across all seven markets. On a compact catalog, hit rate is everything: the overwhelming majority of SKUs earned their place in the feed. That's what it looks like when every product is engineered to win its auction.

06 -

Beyond the ad account

Google Ads doesn't scale a store on its own. The ad accounts told us what to test on the site - and the site results fed straight back into bidding.

- pricing

Systematic price testing

Prices moved up and down, per product and per market, with the response read in both ads KPIs and analytics - optimizing profit and conversion rate together. The repeated surprise: on hero products, higher prices won. Conversion held, margins widened, and each market settled at its own sweet spot.

- landing pages

Landing page testing

Collection pages vs. custom landers vs. product pages, tested per category with live traffic. Where shoppers land is a variable to optimize, not a default to accept.

- the loop

On-site CRO, wired back into bidding

Product pages iterated continuously - layout, imagery, trust, friction - because at this spend level a point of conversion rate is worth more than a point of clickthrough. And every site change fed straight back: price changes shift conversion values, conversion values shift bidding, bidding shifts volume. One system, managed as one.

07 -

The scoreboard

MetricJune 2025November 2025
Monthly store revenue (Shopify)€0€1.15M
Google-attributed revenue~€1k~€840k
Markets live1 (launching)7
Monthly ad spend< €1k~€240k
MER (revenue ÷ ad spend)-~4.7x
Blended ROAS, full six months3.7x - ~€2.1M attributed on ~€570k total spend

Sources: Google Ads (attributed conversion value, data-driven attribution, purchase conversions) and Shopify (store revenue), June-November 2025. Methodology in the "How we measure" note under the chart. Detailed figures available - and walked through live - on a call.

08 -

Is this for your store?

Honest answer: not every store, not every stage. Here's the fit, plainly.

Strong fit

  • Ecommerce with real product margins - D2C brands, multi-store operators, high-volume sellers with proven offers
  • Launching from zero, scaling past a plateau, or taking Google seriously for the first time
  • Messy feed, broken tracking, chaotic account history - we start there, it's week one
  • Owners who can make decisions weekly and want operators, not account managers

Poor fit

  • Products without margin room - no feed can fix unit economics that don't work
  • Set-and-forget expectations - this model is built on daily operation
  • Committee-driven sign-off on every change - speed is half the result
Is my store too small for this?

Maybe - and we'll tell you straight. This case started at under €1k of monthly spend too; what matters is margin, product and ambition, not your current size. If the math doesn't work yet, you'll leave the call knowing exactly what to fix first, free. We'd rather be your agency in six months than waste your budget now.

My feed and tracking are a mess. Problem?

That's the normal starting condition, not a disqualifier. Feed rebuild and tracking re-architecture are the first two weeks of nearly every engagement - we don't scale a euro on data we don't trust.

I already have an account with history. Do you tear it down?

No. Takeovers get a transition plan: we map what's converting, protect it, and earn structural changes with data - the same discipline this case used for budget. Nothing that's making you money gets switched off for the sake of a clean slate.

How fast do you start, and when do I see something?

Kickoff is typically under two weeks from the call - audit, tracking verification, and feed work begin immediately. First structural improvements usually ship in the first two weeks; meaningful performance movement follows the data, and we'll give you an honest timeline for your situation rather than a generic promise.

What does working together look like?

You talk to the people running your account - a small senior team, no handoffs to juniors, no account-manager layer. Daily operation on our side, weekly decisions with you, full transparency on every change. And everything we build in your accounts - feed, tracking, structure - is yours, and stays yours if we ever part ways.

What does it cost?

It depends on markets and workload, so you'll get the exact model and number on the call - before you commit to anything. What we promise up front: no surprises, no long lock-ins, and if the math doesn't work for your stage, we'll tell you that instead of selling you anyway.

Thirty minutes. Your account, open on the screen.

No pitch deck, no slideshow. We'll look at your feed and your account live, and you'll leave with at least three concrete findings - whether or not we ever work together.

Book a strategy call
Any size store welcome - if we're not the fit yet, we'll say so
3 concrete findings, yours either way
Kickoff typically under 2 weeks

One email, four short questions pre-filled - send it as-is and we'll come prepared.

€0 → €1.15M/mo in 6 months. Want the same look at your account?
Book a call